Motivation
Recent technological advances have revolutionized biological sciences. High-throughput “omics” techniques (such as next generation sequencing and mass spectrometry) allow to obtain comprehensive profiles encompassing genes, transcripts, enzymes and metabolites [1-3]. These techniques are nowadays routinely used for research purposes, and had an enormous impact in nearly all the fields of biological and biomedical sciences. Thanks to sequencing, for example, we now have phylogenetic trees encompassing all known living organisms, and we can glimpse the rich diversity of life on Earth [4-6].The unprecedented magnitude of omics data is a true challenge for the mind of any researcher: no human brain can truly grasp datasets comprising thousands of entities (e.g. genes). Thus, we necessarily rely on computational methods to make sense of the data, and also to summarize it in forms that can be visualized and comprehended.
When the data comes from a multitude of species (which we refer to as “comparative data”), there is an additional complication: the phylogenetic dimension, i.e., the fact that all species are related by a specific tree-like structure called phylogeny. The fundamental architecture of data from multiple species is thus defined by genetics; other entities also possess an underlying tree structure, defined by genetics or epigenetics (e.g. different cell types in the body). In the any analysis of comparative data, the phylogenetic structure must be taken into account at all times, since it dictates the trait (co-)variation expected under a null model of neutral evolution [7-9]. Comparative data provides a perspective which is orthogonal to that of most research in biology. Generally, biological systems are studied by measuring and interpreting the response to specific perturbations (e.g. the gene expression shift triggered by a drug treatment or genetic modification). Comparative biology methods work by interpreting the features of living organisms as resulting from “spontaneous experiments” of the natural world. Here, the perturbation dividing our observations is the effect of time and natural selection, acting on different lineages for millions of years after their split from a common ancestor. Because of the massive timescale involved, comparative research can study very large effects (e.g., perturbations in mammals can lead to a lifespan extension of 50%, whereas a 100-fold difference is observed across the mammalian lineage).
We thus embarked on the development of Treedex, a novel visualization and analysis framework, with two main objectives in mind.
- Create a fully interactive environment for the exploration of comparative data of any magnitude, that intuitively conveys the link between measured features and the phylogeny of source species. This will facilitate studying the evolution at large time-scales of fundamental molecular traits, such gene expression and metabolic regulation, that newly generated omics datasets now permit to investigate [10-14].
- Integrate a wide set of state-of-the-art methodologies from evolutionary/comparative biology in the new environment. This will allow to take full advantage of modern comparative omics data, and make these tools easily accessible even to scientists with very limited experience in bioinformatics. The main focus will be on methods of evolutionary inference, which aim to discover the hidden functional links among measured features (e.g., reconstructing functional pathways of genes, analyzing their distribution, or their sequence, across multiple organisms). This includes tools such as phylogenetic profiling, protein coevolution finding, phylogenetic regression and others [15-23]. Additionally, Treedex will implement the widely used statistics employed in evolutionary sequence analysis.
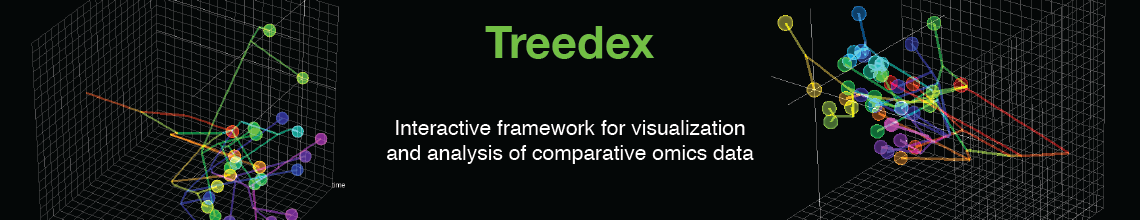
Treedex has also the purpose to go beyond the vision of the phylogenetic tree just as a “complication” in a statistical analysis, and capitalize all the information that the tree can reveal about the functional network topology. Treedex allows to investigate the full evolutionary trajectories of any quantitative and qualitative trait, namely their ‘feature paths’ (a concept illustrate in the figure below). We plan to exploit this mindset as foundation for the design of novel comparative strategies of functional linkage prediction, implemented in practice as measures of ‘feature path similarity’. Such approach will allow to study functional linkage among features of any nature (e.g., sequences and quantitative traits together). Also, it will make possible to explicitly search for evolutionary trends that support functional linkage, such as convergent co-evolution, in a generic geometric setting.

References
- Goodwin S, McPherson JD, McCombie WR. Coming of age: ten years of next-generation sequencing technologies. Nat Rev Genet. 2016 May 17;17(6):333-51.
- Schuster SC. Next-generation sequencing transforms today’s biology. Nat Methods. 2008 Jan;5(1):16-8.
- Di Girolamo F, Lante I, Muraca M, Putignani L. The Role of Mass Spectrometry in the “Omics” Era. Curr Org Chem. 2013 Dec;17(23):2891-2905.
- Hug LA, Baker BJ, Anantharaman K, Brown CT, Probst AJ, Castelle CJ, et al. A new view of the tree of life. Nat Microbiol. 2016 Apr 11;1:16048.
- Hinchliff CE, Smith SA, Allman JF, Burleigh JG, Chaudhary R, Coghill LM, et al. Synthesis of phylogeny and taxonomy into a comprehensive tree of life. Proc Natl Acad Sci U S A. 2015 Oct 13;112(41):12764-9.
- Lima-Mendez G, Faust K, Henry N, Decelle J, Colin S, Carcillo F, et al. Ocean plankton. Determinants of community structure in the global plankton interactome. Science. 2015 May 22;348(6237):1262073.
- Felsenstein J. Phylogenies and the Comparative Method. Am Nat. 1985;125, 1-15. 49.
- Pagel M. Inferring the historical patterns of biological evolution. Nature. 1999 Oct 28;401(6756):877-84.
- László Zsolt Garamszegi (Ed.) Modern phylogenetic comparative methods and their application in evolutionary biology. Concepts and practice. 2014, Springer International Publishing.
- Brawand D, Soumillon M, Necsulea A, Julien P, Csárdi G, Harrigan P, et al. The evolution of gene expression levels in mammalian organs. Nature. 2011 Oct 19;478(7369):343-8.
- Ma S, Yim SH, Lee SG, Kim EB, Lee SR, Chang KT, et al. Organization of the Mammalian Metabolome according to Organ Function, Lineage Specialization, and Longevity. Cell Metab. 2015 Aug 4;22(2):332-43.
- Ma S, Lee SG, Kim EB, Park TJ, Seluanov A, Gorbunova V, et al. Organization of the Mammalian Ionome According to Organ Origin, Lineage Specialization, and Longevity. Cell Rep. 2015 Nov 17;13(7):1319-26.
- Fushan AA, Turanov AA, Lee SG, Kim EB, Lobanov AV, Yim SH, et al. Gene expression defines natural changes in mammalian lifespan. Aging Cell. 2015 Jun;14(3):352-65.
- Levin M, Anavy L, Cole AG, Winter E, Mostov N, Khair S, et al. The mid-developmental transition and the evolution of animal body plans. Nature. 2016 Mar 31;531(7596):637-41.
- Pellegrini M, Marcotte EM, Thompson MJ, Eisenberg D, Yeates TO. Assigning protein functions by comparative genome analysis: protein phylogenetic profiles. Proc Natl Acad Sci U S A. 1999 Apr 13;96(8):4285-8.
- Kensche PR, van Noort V, Dutilh BE, and Huynen MA. Practical and theoretical advances in predicting the function of a protein by its phylogenetic distribution. J R Soc Interface. 2008 Feb 6;5(19):151-70.
- Li Y, Calvo SE, Gutman R, Liu JS, and Mootha VK. Expansion of biological pathways based on evolutionary inference. Cell. 2014 Jul 3;158(1):213-25.
- Tabach Y, Billi AC, Hayes GD, Newman MA, Zuk O, Gabel H, et al. Identification of small RNA pathway genes using patterns of phylogenetic conservation and divergence. Nature. 2013 Jan 31;493(7434):694-8.
- de Juan D, Pazos F, Valencia A. Emerging methods in protein co-evolution. Nat Rev Genet. 2013 Apr;14(4):249-61.
- Marks DS, Hopf TA, Sander C. Protein structure prediction from sequence variation. Nat Biotechnol. 2012 Nov;30(11):1072-80.
- Weinreb C, Riesselman AJ, Ingraham JB, Gross T, Sander C, Marks DS. 3D RNA and Functional Interactions from Evolutionary Couplings. Cell. 2016 May 5;165(4):963-75.
- Pazos F, Valencia A. Similarity of phylogenetic trees as indicator of protein-protein interaction. Protein Eng. 2001 Sep;14(9):609-14.
- Dunn CW, Luo X, Wu Z. Phylogenetic analysis of gene expression. Integr Comp Biol. 2013 Nov;53(5):847-56.